
Netflow with Nfsen
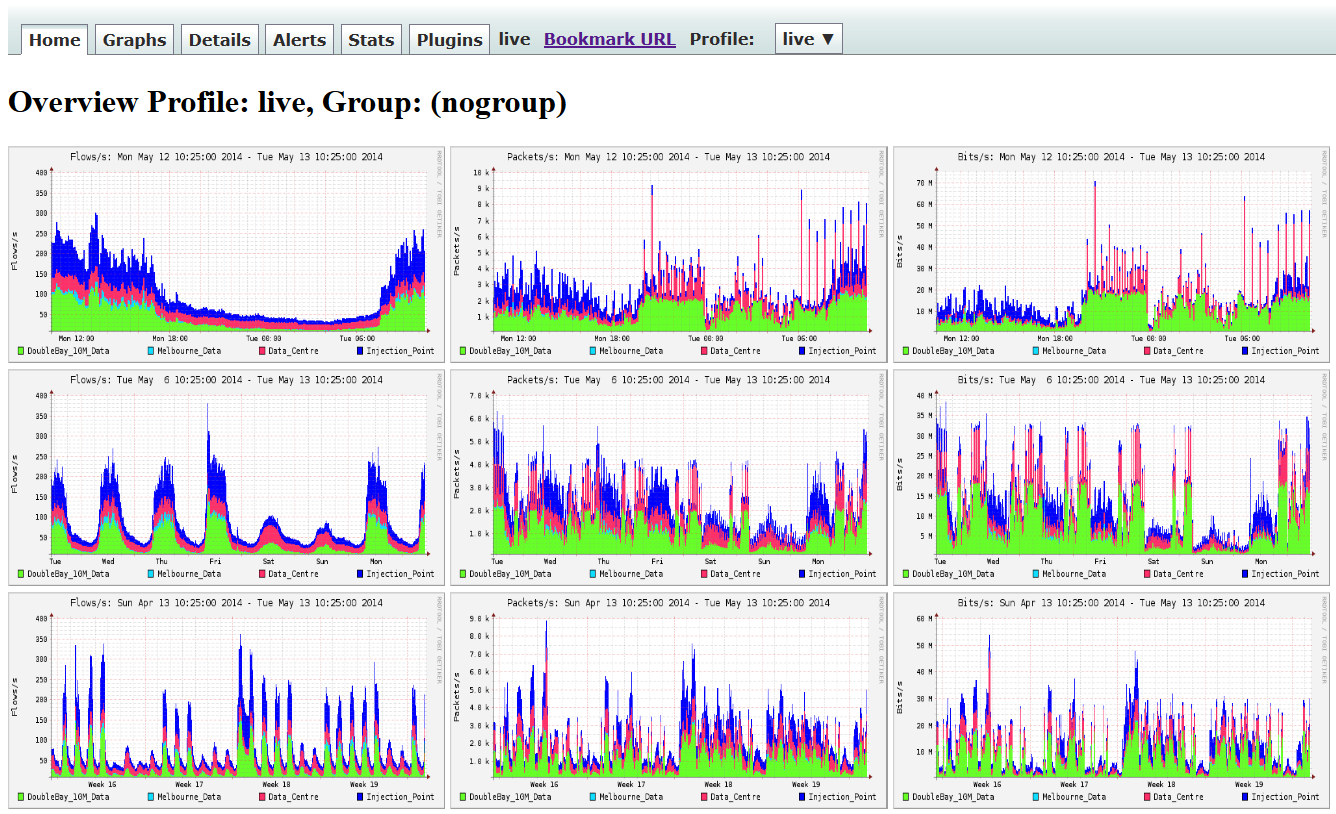
Here’s something I built a long time ago. Its a network graphing tool called NfSen. The system listens to data feeds sent from our Cisco routers and then processes the data and graphs it. The graphs and data are made available by an apache web server so can be viewed anywhere.
It enables us to see at a glance how our network is performing and if there is any unusual behavior occurring. With it we can see how much bandwidth our various connections are using and whether there are any capacity problems on any of our links. If any user has an infected desktop or is running a peer-to-peer sharing program they can be quickly and easily identified.
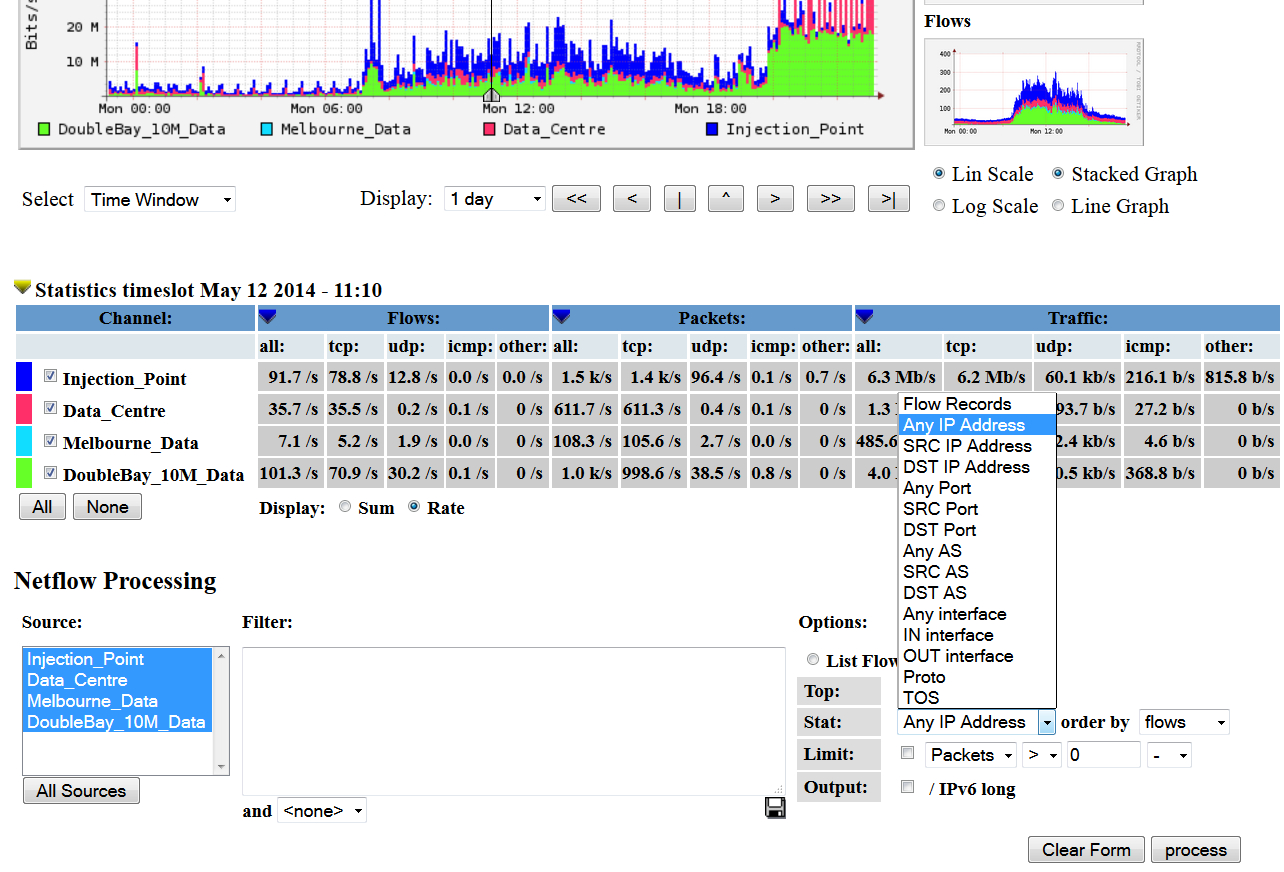
The additional filtering of the data available allows us to see almost any information that we wish about the performance of our network links. I find it hard to remember what life was like without it.
And the best thing about it, cost…$0.00
(P.S. Putting the graphs up on an LCD screen in the IT dept for management to WOW over is fun too!)